Blogs
Display Color Measurement -Background and Applications
Display Color Properties
Displays of all kinds are the main channels for human interaction with various devices. Whether it is a mobile phone, tablet, PC, cars, home appliances, info screens, or machine controllers, displaying information and content on display is the most natural way to interact with people. As the variety and usage of displays increase, the color optics of display performance grows in importance. Can the user see the content clearly from various angles? Are the colors vivid and natural at the same time? Are there unevenness or visible defects on display? Do the colors of two in-device displays match when it comes to dual-screen devices?
The main properties of any display are its luminance, color presentation capability, viewing angle, and grayscale performance. Besides, display clarity in motion content can be decisive for user experience, e.g., VR devices. It is necessary to measure display characteristics in a reliable and repeatable manner to ensure excellent optical performance. Usually, display optical measurements are performed in a laboratory and with a spot measurement device such as a spectroradiometer. The benefit of this approach is measurement accuracy and repeatability, but the downside is the lack of verification in mass production. There is a need to perform display optical measurement, especially color measurement, for all displays in production, and this article discusses the theoretical foundation of utilizing color cameras to perform this task.
Color Spectrum
Color is the human eye perception of light belonging to a specific band of wavelengths. Visible light ranges in wavelengths from approximately 380 nm to 740 nm, which forms the visible spectrum, compared to the invisible spectrum containing, e.g., X-rays, UV light, and IR light. The cone cells of the human eye are sensitive to the wavelengths belonging to visible light, and this physical property allows humans to perceive color. There are mainly three types of cone cells, each sensitive to an overlapping but separate range of wavelengths: short (blue), medium (green) and long (red).
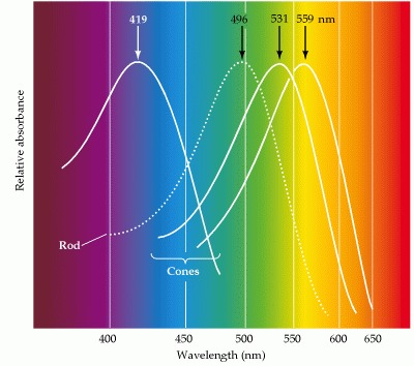
Figure 1: Cone Cells’ Relative Absorbance
Because human vision consists of three types of cone cells sensitive to three primary colors, the human perception of color is an approximation performed by the human brain. Figure 1 shows the cone cells’ relative absorbance rates. [1]
Color Spaces
In color measurement, the colors are expressed in mathematical terms for better calculation and verification. The accurate representation can be done in one of the many color spaces, from which the CIE1931 Yxy and CIE1976 L u’v’ are most used. The CIE1931 Yxy color space is directly derived from the CIE1931 XYZ definition, which maps out all colors visible to the human eye. The downside of the x, y chromaticity presentation is its non-uniform property: the equal distance in the x, y coordinate does not correlate to the same amount of color difference. To improve this aspect, the CIE1976 Lu’v’ color space presents color in a perceptually uniform manner: the equal distance in u’v’ coordinates equals to the amount of color difference observed.
Also, there are other color spaces such as CIELAB (L*a*b*) and CIE1960 UCS (UV), which have their unique place in the industry usage. There exist mathematical functions to convert color values between each of the color spaces, so it is easy to choose the desired color space based on the use case.
Color Gamut
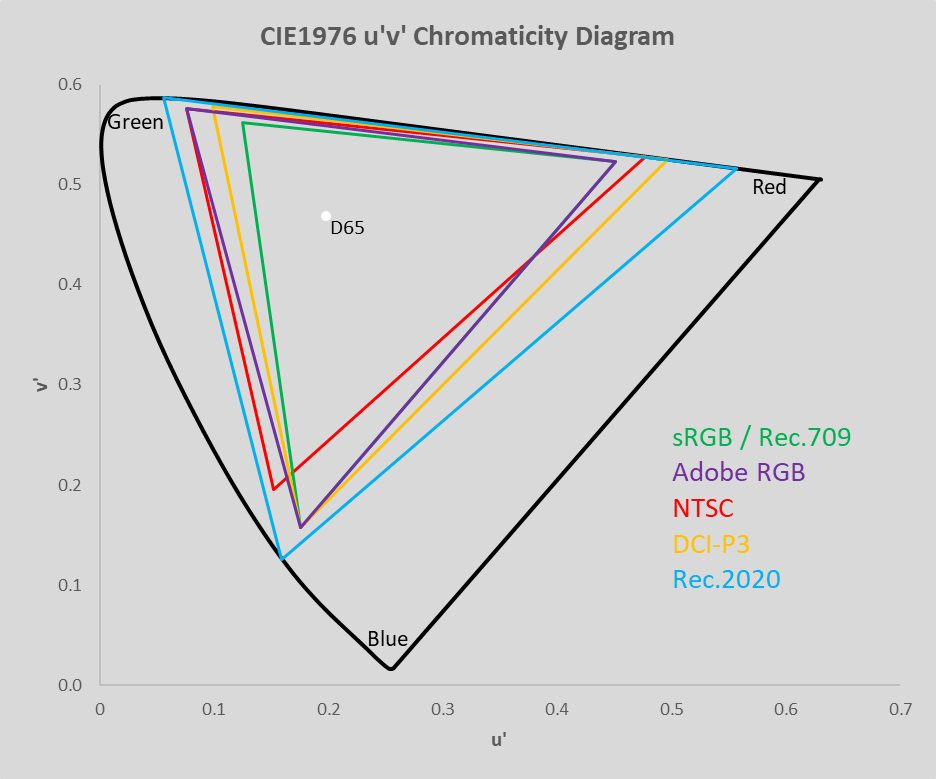
Color gamut is a concept used to express the range of colors that a display can produce. An OLED or LCD can provide only a limited variety of colors due to the materials used, and they cannot produce any color outside of their gamut. As the CIE color spaces contain all colors visible to the human eye, additional industry-defined color spaces are containing only a subset of all colors. All the colors within a color space are described as its gamut. Figure 2 below illustrates the gamut of a few well-known color spaces: sRGB, NTSC, DCI-P3, and Rec.2020. [2]
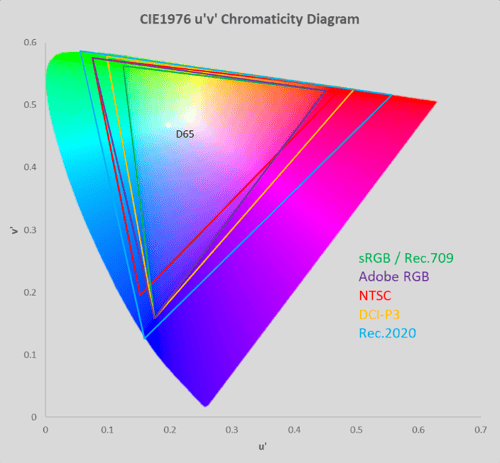
Figure 2: Color Gamut Illustration
The gamut of each color space is contained within a triangle, the vertices of which are the most saturated Red, Green, and Blue color it can present. The gamut of any display can be calculated by first measuring the u’, v’ (or x, y) value of its full Red, Green and Blue colors, and then calculating the area within. However, the mathematical representation of the gamut area is seldom useful, but the gamut is often expressed as the percentage compared to a well-known color space.
For example, the gamut of DCI-P3 is 26% bigger than sRGB, and Rec.2020 is 72% bigger than sRGB. Current display technology cannot adequately produce the DCI-P3 gamut but is more than enough to display sRGB content accurately.
Color Measurement – Spectrometers
To accurately measure color, optical instruments are constructed to measure the amount of light on each wavelength; by combining the wavelength and amplitude information, the exact color value can be calculated. A unique spectrum can describe the property of each color. For example, the daylight white color spectrum (D65) is presented in Figure 3, and the CIE illuminant A spectrum in Figure 4.
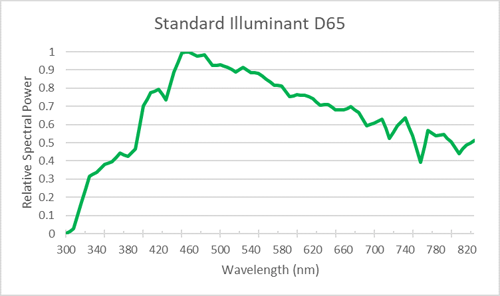
Figure 3 CIE D65 Spectrum (Normalized to 1 at 560nm)

Figure 4 CIE Illuminant A (Normalized to 1 at 560nm)
A spectrometer is a device that accurately measures the color spectrum. In a spectrometer, the incoming light is scattered through an optical grating system in such a way that a set of photosensitive pixels measures the scattered light beams. Through factory calibration, each pixel corresponds to a wavelength. Thus, the data captured by the pixels represents the spectrum of the measured light.
For example, Figure 5 shows the spectrum of white color on an OLED display, where the three peaks of R (Red), G (Green), and B (Blue) stand separated from each other in the OLED display as the RGB OLED material each produce their separate spikes. Figure 6 shows the spectrum of the white color of an LCD, which closely resembles the typical spectrum of white LEDs, which are the light source of LCDs in this case.

Figure 5 OLED Display White Color Spectrum (Example)

Figure 6 LCD Display White Color Spectrum (Example)
Reference Illuminants – Why Are They Needed?
The color of any object observed by the human eye is tightly dependent on the ambient lighting conditions in which it is viewed because the observed light is a mixture of the object color and the color of reflected ambient light. If one looks at an object under daylight and then under tungsten light, one might observe the color hue difference between these lighting conditions.
The difference is especially visible on some hues, which are a mix of primaries, e.g., cyan, magenta, and yellow.
When performing a reflective color measurement, the light source needs to be known to consider its impact on the measurement result correctly. For this purpose, CIE has defined a set of standard illuminants to be used in reflective measurements. The illuminant A corresponds to the Spectral Power Distribution (SPD) of traditional tungsten light. The deficit of illuminant A is its lack of UV component below 340 nm. Thus, the D illuminant series is developed to include also the UV component and better correspond to real daylight conditions. Even though D illuminant series are easy to model mathematically, it is not yet possible to accurately produce them. When handling measurement results and including the used standard illuminant into calculations, the resulting color is how the human eye sees the object at defined lighting conditions. In this way, the real-world color performance can be measured unambiguously.
When performing a color measurement on an emissive light source such as an OLED display or a LED, or a transmissive light source such as an LCD, a spectrometer device captures emitted/transmitted light and analyzes its spectrum. When ambient light is not impacting the measurement, there is no need to consider standard illuminants. If a colored camera is used to measure color, standard illuminants need to be considered due to the color space transformations necessary to produce accurate results.
Color Measurement – RGB Cameras
Spectrometers accurately measure color through inspecting the spectral power distribution of the light, but spectrometers are often expensive, and their measurement area is small compared to RGB cameras. The question follows, how well can color be measured utilizing RGB cameras? Table 1 below presents some fundamental differences between spectrometers and RGB cameras.
Table 1 Comparison Between Spectrometer and RGB Camera
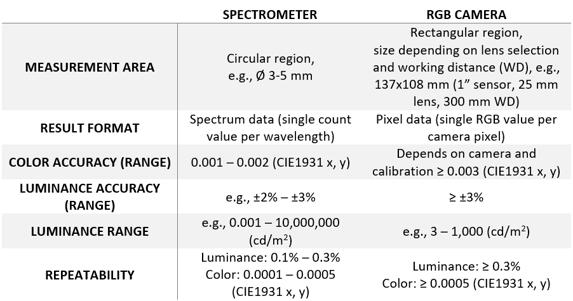
From the table above, it is evident that RGB cameras, even at their best, cannot perform very accurate optical measurements. The term RGB camera in this context refers to any digital camera which provides colored (RGB) image results as an output. Traditionally, RGB cameras differ from monochrome cameras by their additional color filter layer, which allows only one color to pass to each sensor pixel (see Figure 7). The color filter is arranged in a mosaic (e.g., Bayer) pattern, which allows the easy interpolation to get RGB values for each pixel (see Figure 8). The downside of the mosaic pattern RGB cameras also lies in the interpolation: the pixel values are averaged, and measurement accuracy is compromised. For mosaic patterned RGB cameras, optical measurement accuracy is seldom sufficient for mathematical evaluation, e.g., color calibration is impossible.

Figure 7: RGB Camera with Color Filter

Figure 8: An Example of Bayer Mosaic Color Filter Pattern
Another RGB camera type consists of three sensors and a prism, which scatters incoming light into red, green, and blue components for each sensor (see Figure 9). In this approach, the RGB value is the combination of the pixel value from each sensor. Because the light is scattered and thoroughly captured by respective sensors, the measurement result is accurate with relatively high color resolution. This helps to differentiate between colors with minor variations, which is impossible for a mosaic pattern RGB camera to achieve.
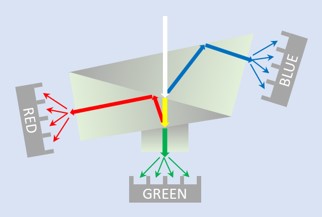
Figure 9: An Illustration of the 3-Sensor Prism Camera
RGB to CIE1931 XYZ Conversion
RGB cameras usually provide RGB output with an 8- or 12-bit resolution. However, there is no direct relationship between RGB values and absolute color values, such as CIE1931 Yxy. To enable the RGB results to be converted into absolute color values, they need to be first converted into CIE1931 XYZ space. From XYZ space, the values can be converted to practically any color space through simple mathematical functions.
The conversion from RGB to XYZ is practically a mathematical procedure: multiply the RGB value by a camera-specific conversion matrix to get the XYZ value. The camera-specific matrix can be generated by calibrating the camera response against a known optical target, e.g., a D65 illuminated light source. It should be noted that when making the conversion matrix one should utilize multiple optical targets to achieve good accuracy with various types of light.
For example, to generate the conversion matrix for an RGB camera, three light sources are chosen: D65, A, and D50. Each light source is measured with an accurate spectrometer to get its XYZ value; then, the corresponding RGB values are measured with the camera under calibration. The conversion matrix is then generated by multiplying the XYZ matrix with the RGB matrix as follows:

Equation 1
When the conversion matrix is available, the XYZ value of captured data can be calculated solely with the matrix multiplication below:

Equation 2
The resulting XYZ is enough for calculating absolute color coordinates, e.g., in CIE1931 xy. Still, to have a total luminance value, it is necessary to scale XYZ values according to the exposure time of the captured data.
RGB 8- versus 12-bit Pixel Format
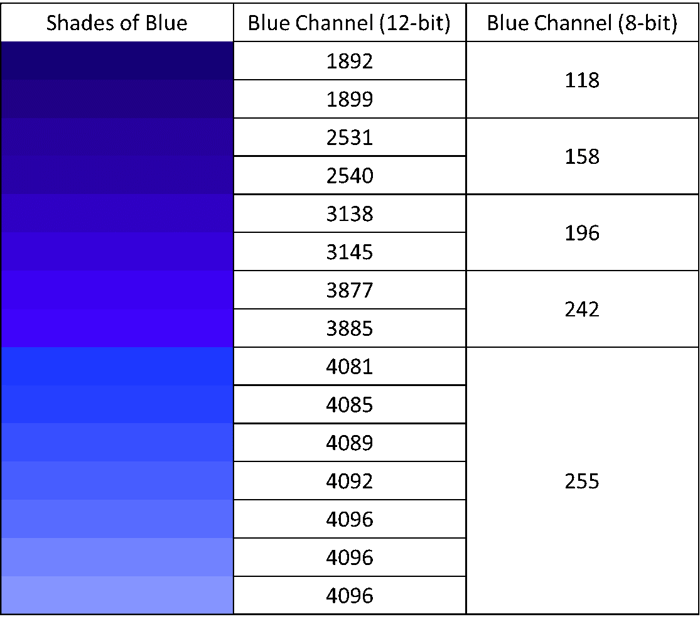
Most RGB cameras provide their output in either an 8- or 12-bit format, which could indicate that the camera sensor is operating at 8- or 12-bit Mode. Some cameras always work with 12-bit and only convert the results to the 8-bit format when the user wants to. There is significant difference in achievable accuracy if comparing 8-bit versus 12-bit sensor operation. If the camera sensor operates at 8-bit Mode, there are only 256 available data values for each pixel. Thus, some colors with minimal differences will be reported to be equal. If the sensor operates at 12-bit Mode, there are 15 additional levels between each of the 8-bit values, providing a better possibility to differentiate between similar colors.
Table 2 demonstrates the difference between 8- and 12-bit accuracy. It should be noted that in the example below, the brightest hues of blue have saturated the blue channel, but the green and red channels bring the observable difference. It is essential to utilize as high a bits-per-pixel pixel format as possible to reach better accuracy in differentiating color hues.
Table 2 Example of Resolution Difference Between 8- and 12-bit Mode
References:
[1] Purves D, Augustine GJ, Fitzpatrick D, et al., editors. Neuroscience. 2nd edition. Sunderland (MA): Sinauer Associates; 2001. Available from: https://www.ncbi.nlm.nih.gov/books/NBK10799/
Written by


